Foodies
Overview
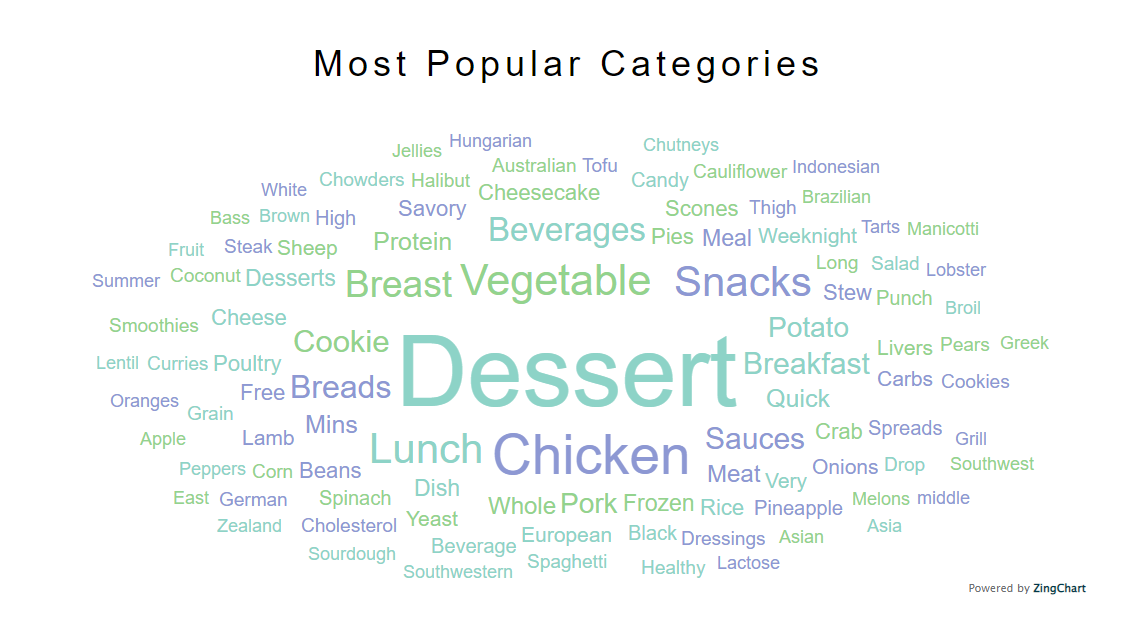
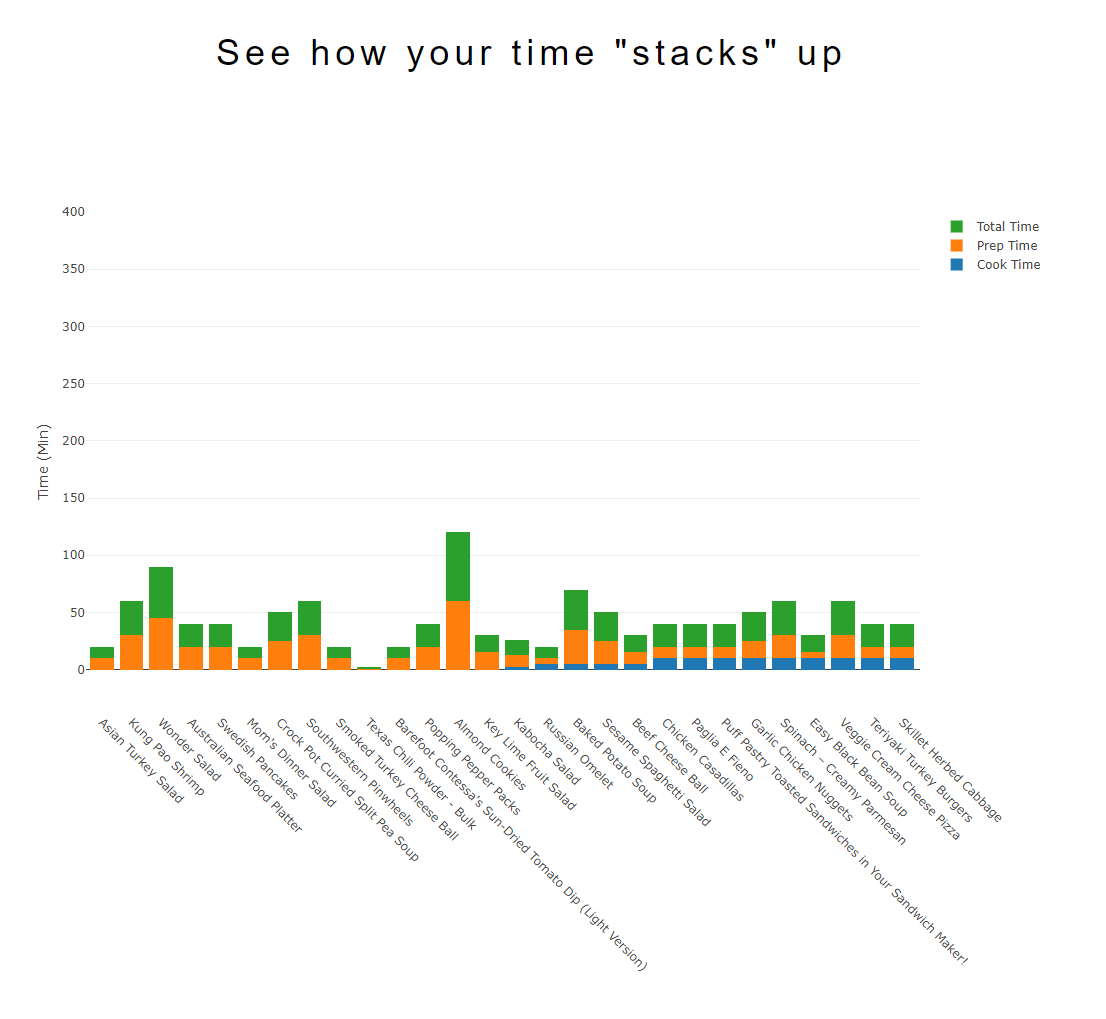
Foodies was developed in ICS 484 Data Visualization at UH Manoa. It was developed by a group of ICS and ACM students and the dataset that we are using comes from food.com made by the user named Alvin at kaggle and it provides information about each recipe like cooking times, servings, ingredients, nutrition, and more. It contains 522,517 recipes from 312 different categories with 28 different attributes such as nutrition content(fat, saturated fat, cholesterol, sodium, etc.) and time(cook time, prep time, total time). We want to create a visualization that can help others easily find what recipes they can make by answering specific questions that they have like this:
Since this data focuses on the time it takes to make as well as the nutrition of various recipes, we can easily see what recipes we can use in our daily lives.
You can learn more or view our project on our project home page here.
Contributions
This project was made by two ICS students and two ACM student where I was leading the project. Here is a list of what were some of my contributions were when developing this game: